

The Tax-to-Inflation Transmission Index (TITI): Framework and Descriptive Evidence for Australia, 2020-2026
Abstract
Two direct effects of tax and fiscal measures on Australian prices can be measured, but the share of 2020-2026 inflation attributable to tax and fiscal policy as a whole cannot. We propose the Tax-to-Inflation Transmission Index (TITI), a country-independent framework that separates taxation causing price pressure from inflation raising tax revenue, and grades every finding on a six-level scale of causal evidence. Applying it to Australia with primary data from the ABS, RBA, Treasury, ACCC, Parliamentary Budget Office and OECD, we find four results. First, the 2026 fuel excise cut of 32 cents per litre, identified from a dated statutory change and regulator price data, lowered headline CPI by about 0.5 percentage points in the month it took effect (bounds 0.36 to 0.61), so a 10 cent change in excise moves headline CPI by about 0.16 points. Second, energy bill rebates lowered the electricity price index by about 40 per cent and headline CPI by roughly 0.7 to 1.1 points by October 2024, and their unwinding lifted measured electricity prices by 21 to 25 per cent in early 2026. Third, tax revenue outgrew nominal GDP in every year from 2021-22 to 2024-25 (ratios of 1.09 to 1.45), and all-levels tax rose from 27.7 to 30.2 per cent of GDP, consistent with prices, wages and profits lifting nominal tax bases. Fourth, official diagnoses attribute inflation mainly to supply disruption, energy, capacity pressure and unit labour costs rather than to tax changes. Every other TITI value, and any aggregate share, is reported as NOT IDENTIFIABLE. We set out the designs that could identify more and release tested code that refuses to report a number without a declared identification strategy.
Keywords: inflation, tax incidence, tax pass-through, fiscal policy, Australia, causal identification
JEL codes: E31, E62, H20, H22
Results at a glance
| Finding | Result | Evidence |
|---|---|---|
| Fuel excise cut, 2026 | About -0.5 points on headline CPI in the month of the change (bounds -0.36 to -0.61); 0.016 points per cent per litre | Level 5 for pass-through; accounting for headline |
| Energy rebates | Electricity index 39.9% lower than without rebates by Oct 2024; headline -0.7 to -1.1 points | Level 5 for component; accounting for headline |
| Tax revenue versus nominal GDP | Buoyancy 1.09 to 1.45 (2021-22 to 2024-25); tax 27.7% to 30.2% of GDP | Level 1 |
| Stage 3 tax cuts | Personal income tax growth fell from 11.9% to 1.5% | Level 2 |
| Share of inflation due to tax and fiscal policy as a whole | NOT IDENTIFIABLE | None |
Introduction
Australian consumer prices rose 7.8 per cent in the year to December 2022, the fastest since 1990, and were rising again at 4.6 per cent in March 2026 (monthly measure). Public debate often asks who is to blame. This paper asks a narrower empirical question: how much of observed inflation can reasonably be associated with taxation and fiscal policy, through which mechanisms, in which periods, and with what statistical confidence?
Two difficulties make the question hard. Causation runs in both directions: a tax change can raise prices, and rising prices, wages and profits raise nominal tax revenue through bracket creep, higher company profits and higher property values. Many tax and fiscal changes also coincide with other shocks, for example energy prices, monetary tightening and supply disruption, so simple correlations mislead.
We make four contributions.
The paper is mainly descriptive and diagnostic. It identifies two direct, first-round effects (fuel excise and energy rebates), reports every other TITI value as NOT IDENTIFIABLE, and says so where that limits a conclusion. Section 2 reviews related work, Section 3 sets out the framework, Sections 4 to 7 present data and Australian evidence, Section 8 sets out the identified estimates and remaining designs, and Sections 9 to 11 discuss trade-offs, limitations and conclusions.
Related literature
This is a focused review of the strands the framework draws on, not a systematic survey.
Tax pass-through to prices. Microeconomic studies compare retail prices around discrete tax changes. Marion and Muehlegger (2011) find that US federal and state fuel taxes are passed through to consumer prices at least in full and possibly more than in full, while work on beverage excises reports over-shifting (Young and Bielinska-Kwapisz, 2002). Poterba (1996) studies US sales taxes, and Kosonen (2015) studies a service-sector VAT cut, illustrating that pass-through depends on market structure and the tax base. These designs suit component-level questions such as the 2026 fuel excise cut, but they do not measure aggregate inflation.
Identifying macroeconomic effects of tax changes. Because tax changes respond to the economy, macroeconomists use narrative and instrument-based identification (Romer and Romer, 2010; Mertens and Ravn, 2013) and estimate dynamic responses with local projections (Jordà, 2005). TITI adopts the same insistence on exogeneity before any causal reading.
Margins, mark-ups and inflation. The RBA (2026a) stresses that the relation between margins and inflation depends on why margins change. Related work includes Glover, Mustre-del-Rio and von Ende-Becker (2023), Champion, Edmond and Hambur (2023), and Menezes and Quiggin (2022), who study market power and demand shocks. RBA staff also review non-linear Phillips curves (Georgiakakis, Hambur and Ryan, 2026).
Revenue feedback. Tax revenue rises with nominal bases. The OECD (2025) documents that the average tax-to-GDP ratio across member countries reached a record 34.1 per cent in 2024. TITI treats this feedback as a separate causal path so that rising revenue is not read as evidence that tax caused inflation.
Gap addressed. Component-level pass-through studies and macro identification methods are usually applied separately. TITI combines them in one transmission profile per tax, adds an explicit reverse-causality path, and attaches an evidence grade to every result.
The TITI framework
TITI does not assume that taxation causes inflation. It tests a chain, tax policy to liability and incidence, to household and business behaviour, to aggregate demand and supply, to market prices, to CPI, and it models the reverse chain separately.
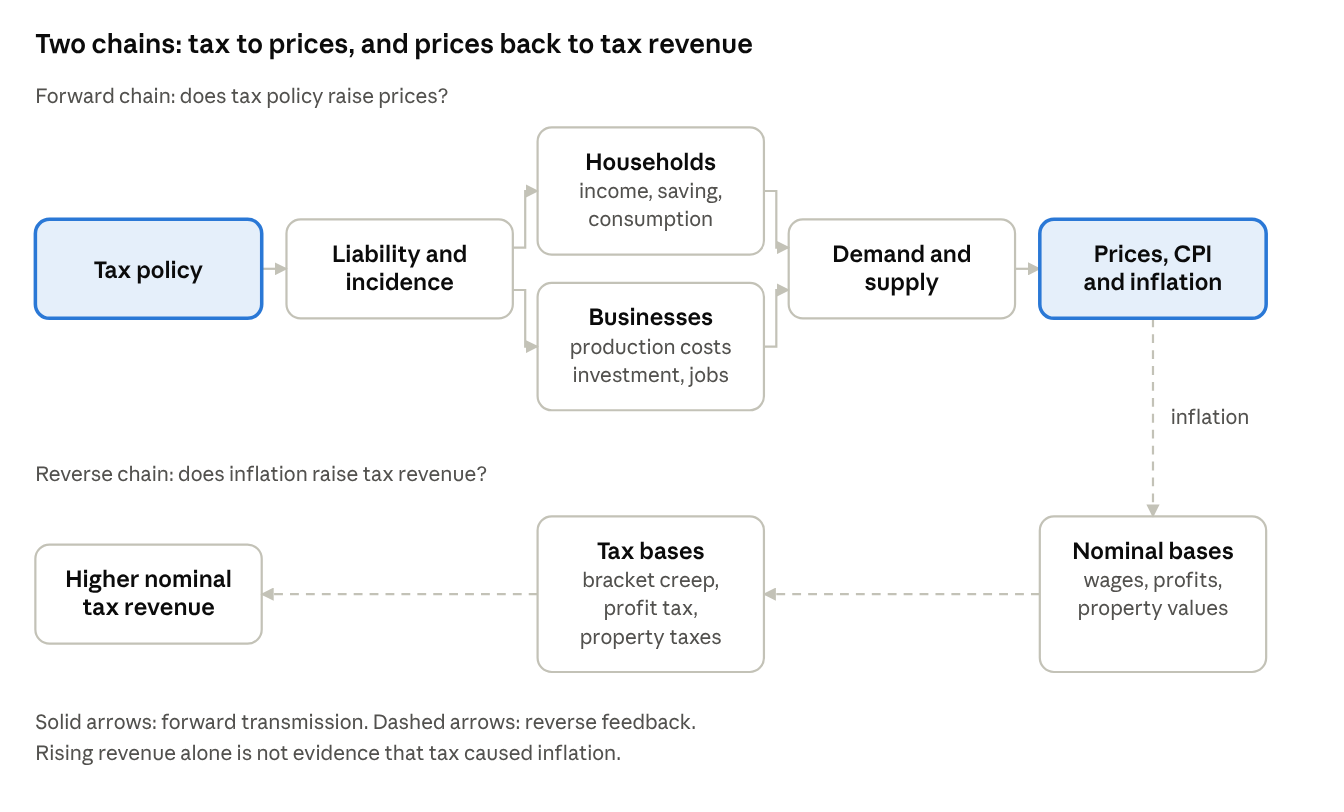
Figure: TITI transmission architecture, forward chain from tax policy to CPI and reverse chain from inflation to tax revenue
The forward chain asks whether tax policy raises prices; the reverse chain asks whether inflation raises tax revenue. TITI estimates the two separately.
Five-stage incidence record. For each major tax we record who is legally liable; who economically bears the burden; the behavioural response; the effect on prices, wages, profits, employment, investment, consumption and housing; and the estimated CPI effect. Each transmission is classified as DIRECT, INDIRECT, DEMAND-SIDE, SUPPLY-SIDE, SECOND-ROUND, REVERSE-CAUSAL or UNCERTAIN.
Reverse causality. Three feedbacks run from inflation to revenue: nominal income growth pushing taxpayers into higher brackets, higher nominal corporate profits raising company tax, and higher property values raising transaction and property tax bases. Any rise in revenue must be tested against these before it is read as evidence of tax-driven price pressure. Revenue growth is decomposed into rate changes, base expansion, prices, wages, profits, real growth, compliance and administrative changes where data allow.
The TITI metric. For a tax or policy i and horizon h (short, medium, long):
TITI_i^{h} = \frac{\Delta \mathrm{CPI}_i^{h}}{\Delta \mathrm{TaxPolicy}_i}The ratio is reported with a confidence interval only where it is economically meaningful and statistically identified. Otherwise the result is NOT IDENTIFIABLE. TITI is a transmission profile, not a good-or-bad score, and it is never used to rank countries.
Evidence grades. Every finding carries one of six levels, and Levels 1 and 2 are never described as causal.
| Level | Evidence | Causal language allowed |
|---|---|---|
| 1 | Descriptive correlation | No |
| 2 | Temporal association | No |
| 3 | Predictive relationship | No |
| 4 | Econometric causal evidence | Yes, with stated assumptions |
| 5 | Natural or quasi-experimental evidence | Yes |
| 6 | Strong identification supported by multiple methods | Yes |
Data and sources
All evidence comes from primary official publications accessed on 29 September 2026; 56 numerical claims are logged with source, series, period, unit, methodology and access date in the project's source register.
| Source | Series used | Period |
|---|---|---|
| ABS, Consumer Price Index (monthly and quarterly) | Headline, trimmed mean, components, weights, electricity with and without rebates | 2020 to Jul 2026 |
| RBA, Statements on Monetary Policy, minutes, decisions | Cash rate, assessments, forecasts, fuel contribution estimates | 2020 to Sep 2026 |
| ACCC, weekly and quarterly fuel price monitoring reports | Retail and terminal gate (wholesale) petrol and diesel prices, excise pass-through | 2022 and 2026 |
| ABS, Taxation Revenue and GFS Insights, 2024-25 | Tax by type, all levels of government, per cent of GDP | 2015-16 to 2024-25 |
| Treasury and Finance, Final Budget Outcomes; Budget 2026-27, Budget Paper 1 Statement 5 | Commonwealth cash receipts by head | 2021-22 to 2029-30 (estimates from 2025-26) |
| ABS, Wage Price Index; Total Value of Dwellings; Population; National Accounts | Wages, dwelling values, population and migration, GDP | 2021 to Jun 2026 |
| Parliamentary Budget Office; OECD Revenue Statistics 2025 | Tax base outlook; cross-country tax-to-GDP | 2024 to 2029-30; 2024 |
Three data cautions apply throughout.
Australian inflation, 2020-2026
Inflation peaked at 7.8 per cent in December 2022, fell to about 2 per cent in late 2024, and re-accelerated to 4.6 per cent in March 2026 before easing to 3.5 per cent in July 2026 (ABS). Official bodies attribute each phase mainly to non-tax factors, though tax and fiscal measures shifted specific prices at specific dates.
| Year | Headline reading (ABS) | Official diagnosis and policy events |
|---|---|---|
| 2020 | December quarter CPI +0.9%; tobacco +10.9%, child care +37.7% | Tobacco excise up 12.5%; free child care unwound |
| 2021 | December CPI 3.5% y/y; fuel +32.3% y/y | Goods inflation above services; supply-chain and material shortages |
| 2022 | December CPI 7.8% y/y, highest since 1990 | Record new-dwelling inflation; fuel excise halved April to September; cash rate raised from 0.10% in May |
| 2023 | September quarter CPI 5.4%, trimmed mean 5.2% | Cash rate peaks at 4.35%; energy rebates begin July |
| 2024 | October monthly CPI 2.1%; electricity -35.6% y/y | Commonwealth and State energy rebates; Stage 3 tax cuts from 1 July |
| 2025 | November monthly CPI 3.4%; electricity +19.7% y/y | RBA cuts to 3.60%; RBA sees broad late-year pick-up as demand outrunning capacity |
| 2026 | March CPI 4.6% (fuel +32.8% in month); July 3.5%, trimmed mean 3.6% | Middle East oil shock; fuel excise cut then restored; cash rate raised four times to 4.60% |
The RBA attributed 0.8 percentage points of March 2026 headline inflation to fuel prices, expects second-round effects on goods and services, and judges the economy to be operating above capacity with weak productivity (RBA, 2026b, 2026c). Government attributes about half a percentage point of lower inflation in the year to June 2024 to energy rebates, rent assistance and child care changes (Treasury, 2024); we treat that as a government attribution, not an independent estimate.
Measurement notes. Quarterly and monthly year-ended CPI differ (June 2026: 3.9 per cent quarterly per the RBA, 3.8 per cent monthly per the ABS). From late 2025 the ABS moved to a complete monthly CPI and a revised trimmed mean, so 2025-26 is not strictly comparable with earlier quarterly data.
The tax-revenue side
All-levels tax revenue rose from $551.8 billion in 2019-20 to $839.0 billion in 2024-25, and from 27.7 to 30.2 per cent of GDP (ABS; Figure 1), growing faster than nominal GDP in every year from 2021-22.
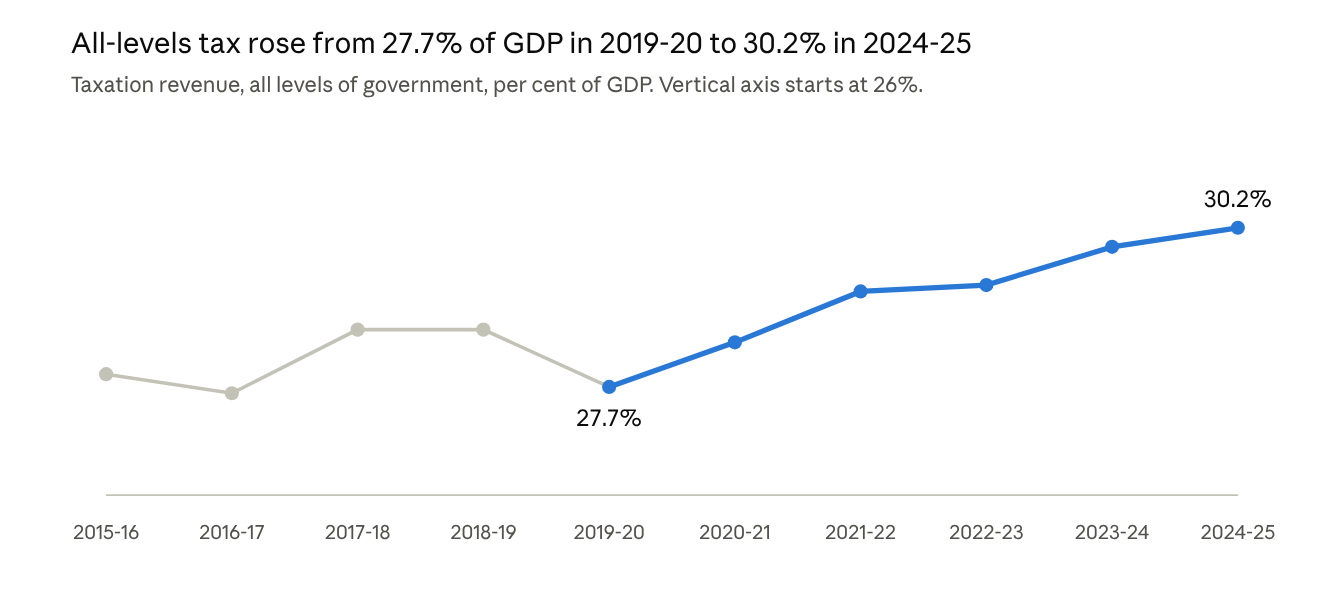
Figure 1. ABS, Taxation Revenue, Australia 2024-25, all levels of government, per cent of GDP, 2015-16 to 2024-25; accessed 29 Sep 2026
| Financial year | Nominal GDP growth (%) | Tax revenue growth (%) | Buoyancy (ratio) |
|---|---|---|---|
| 2021-22 | 11.0 | 15.2 | 1.38 |
| 2022-23 | 9.7 | 10.6 | 1.09 |
| 2023-24 | 4.2 | 6.1 | 1.45 |
| 2024-25 | 3.6 | 4.7 | 1.30 |
Nominal GDP growth is taken from the Final Budget Outcomes and Budget 2026-27, not the current ABS national accounts, and may since have been revised. A ratio above one is consistent with nominal bases rising with prices, wages and profits, which is the reverse channel in Section 3. It is an accounting relation and cannot separate price effects from real growth, rate changes or compliance (Level 1).
What drove Commonwealth growth. Company tax and personal income tax supplied most growth in 2021-22 and 2022-23. The Final Budget Outcomes attribute company-tax upgrades to elevated commodity prices, strong employment and low take-up of COVID-19 business supports, which is a government attribution. Company tax then fell in 2023-24 and 2024-25, and the ABS links the 2024-25 fall to lower mining profits (Figure 2).
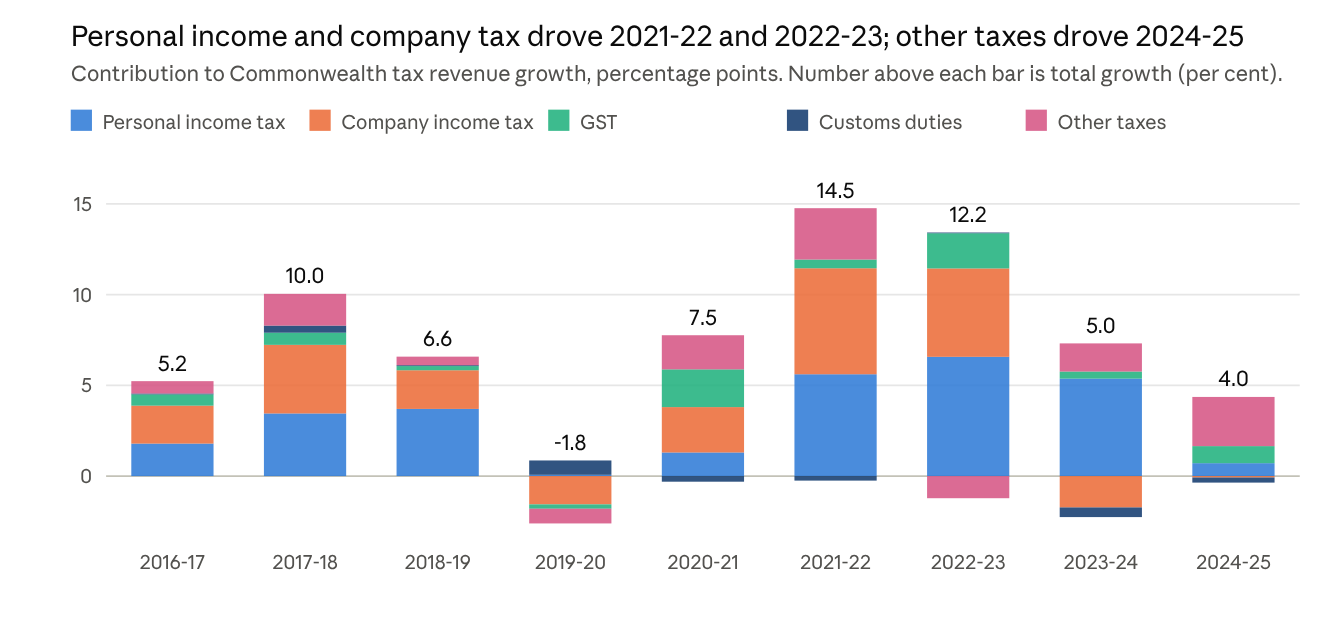
Figure 2. Contributions computed from ABS, Insights into Government Finance Statistics 2024-25, Commonwealth taxation by type ($b), 2016-17 to 2024-25
Stage 3 and personal income tax. Commonwealth personal income tax grew 11.9 per cent in 2023-24 and 1.5 per cent in 2024-25, after the Stage 3 cuts began on 1 July 2024 (ABS). Income tax withholding rose 0.3 per cent in 2024-25 while compensation of employees grew 6.2 per cent (Budget 2026-27). This is a dated policy coinciding with the change (Level 2). Bracket creep itself is not measured here.
Excise. Tobacco excise receipts fall from $12.6 billion in 2022-23 to $4.1 billion in 2025-26 (estimate), which Treasury attributes to weak collections and lower excisable volumes, while CPI alcohol and tobacco inflation stayed high (7.2 per cent in July 2024; 5.5 per cent in September 2025). The 2026 fuel excise cut of 32 cents per litre (a 60.9 per cent reduction, from 52.6 to 20.6 cents, delivered in two steps described in Section 8) costs about $2.9 billion of net excise revenue, $2.5 billion net to the Commonwealth.
GST. Cash GST receipts grew 6.2 per cent in 2024-25 (ABS: 6.9 per cent), but the Budget's parameter for consumption subject to GST grew only 2.6 per cent. We leave this unreconciled and do not attribute GST growth to prices.
States and local government. Between 2020-21 and 2024-25 payroll tax rose 69 per cent, land tax 79 per cent and municipal rates 22 per cent, while stamp duty followed dwelling prices (Figure 3). Whether these business and property taxes feed into rents, wages or prices is not identified.
Figure 3. Index computed from ABS, Insights into Government Finance Statistics 2024-25, state and local taxation by type ($b), 2015-16 to 2024-25
Housing tax expenditures. In 2025-26 the main residence capital gains tax discount ($32.0 billion) and rental deductions ($29.2 billion) are among the largest measured tax expenditures. These are revenue-forgone estimates that assume no behavioural change, so they do not measure the revenue gain from removal.
Transmission channels and the TITI profile
Two channels have identified direct effects, the fuel excise and the energy rebates; every other TITI value is not identifiable. Signs follow the convention that TITI is the change in CPI divided by the change in the tax policy, so cutting a tax that lowers CPI gives a positive ratio.
| Policy | Transmission class | Result | Level | TITI |
|---|---|---|---|---|
| Fuel excise, 2026 | DIRECT | 32c/L cut lowered headline CPI by about 0.5 points in the month of the change (bounds 0.36 to 0.61) | 5 (pass-through), accounting (headline) | Short run: 0.016 points per c/L (0.011 to 0.017). Medium and long run: NOT IDENTIFIABLE |
| Fuel excise, 2022 | DIRECT | 24.3c/L cut with GST; ACCC finds full wholesale pass-through and most locations within six weeks | 5 (pass-through) | Headline effect not computed |
| Energy rebates | DIRECT (measurement) | Electricity index 39.9% lower than without rebates by Oct 2024; headline -0.7 to -1.1 points; unwinding lifted electricity 21% to 25% y/y in 2026 | 5 (component), accounting (headline) | Cumulative level effect; per-dollar elasticity NOT IDENTIFIABLE |
| Tobacco excise, 2020 | DIRECT | Excise +12.5%; tobacco CPI +10.9% in the December quarter | 1 | NOT IDENTIFIABLE |
| Personal income tax, Stage 3 | DEMAND-SIDE | PIT growth 11.9% to 1.5%; withholding flat | 2 | NOT IDENTIFIABLE |
| GST | DIRECT, UNCERTAIN | Revenue growth exceeds base parameter | 1 | NOT IDENTIFIABLE |
| Company and resource taxes | REVERSE-CAUSAL, UNCERTAIN | Revenue follows commodity prices | 1 | NOT IDENTIFIABLE |
| Payroll tax | SUPPLY-SIDE candidate | Revenue +69% over four years | 1 | NOT IDENTIFIABLE |
| Land tax, stamp duty, rates | Housing, REVERSE-CAUSAL | Stamp duty tracks dwelling prices | 1 | NOT IDENTIFIABLE |
| Negative gearing and CGT reform (2026-27 Budget) | Housing | Details not retrieved | none | NOT ASSESSED |
Two results deserve emphasis. First, fiscal transfers change measured prices without changing resource costs: the ABS counts energy rebates as lower electricity prices, so their unwinding raised measured inflation in 2026 without any new cost shock. Second, businesses recover most fuel excise through fuel tax credits except the heavy-vehicle road user charge, so the excise's direct price channel is mainly households (petrol) and heavy freight.
Identification strategy and status of estimates
Two direct effects are identified below; every other TITI value stays not identifiable. The identified estimates come from dated statutory changes and regulator or statistical-agency data, not from the 26-quarter aggregate window, which is too short for time-series identification.
Fuel excise, 2026 (short run, direct). The excise fell in two dated steps: a halving worth 26.3 cents per litre on 1 April, and a further 5.7 cents from a State agreement to forgo fuel GST revenue, 32 cents in all (ACCC, 2026). Excise is charged at the wholesale level, so it moves the wholesale price mechanically. The pass-through link is identified from the regulator's price data. Across the five largest cities, average terminal gate petrol fell 47.5 cents and retail petrol fell 65.4 cents between 31 March and 22 April, while international refined petrol fell about 20 cents, so the 32 cent cut plus the oil move accounts for the wholesale fall and retail fell by at least as much. About 84 per cent of retail sites had cut regular unleaded petrol by 32 cents by 12 April. The 2022 halving (22.1 cents, or 24.3 with GST) shows the same pattern, with full wholesale pass-through and most locations at the bowser within six weeks (ACCC, 2022). Diesel is not identified because refined diesel prices rose sharply at the same time.
The translation to headline CPI is accounting: the effect equals the fuel weight times the pass-through times the pump-price wedge divided by the pre-cut price.
| Input or result | Value | Source |
|---|---|---|
| Automotive fuel weight | 3.5% of the basket; 4.6% effective after March's 32.8% price rise | ABS |
| Pre-cut price, petrol and diesel weighted 90:10 | 263.7 c/L (petrol 257.2, diesel 322.4) | ACCC, ABS |
| Pump-price wedge | 32.0 to 35.2 c/L (32 plus 3.2 c/L GST effect) | ACCC, Treasury |
| Pass-through | 0.84 to 1.00 | ACCC site-level analysis |
| Headline CPI effect | -0.36 to -0.61 points; RBA estimate about -0.5 | Computed; RBA |
| TITI, short run | 0.011 to 0.017 points per c/L; central 0.016 | Computed; RBA estimate divided by 32 |
The RBA's own estimate, that the cut would subtract about 0.5 points from year-ended inflation in April (RBA, 2026d), lies inside these bounds. The bounds come from documented input ranges, not sampling error, and cover only the first-round price effect in the month of the change. Second-round effects, the demand response and the restoration steps on 1 July and 3 August are not identified.
Energy rebates (level effect, direct measurement). The ABS publishes electricity prices with and without government rebates, a measured counterfactual. By October 2024 electricity was 30.2 per cent lower than in June 2023 including rebates and 16.1 per cent higher excluding them, so the rebates lowered the index by 39.9 per cent. With an electricity weight of 1.8 per cent (2025) to 2.8 per cent (2021 peak), that is 0.7 to 1.1 points off headline CPI. The weights come from a secondary compilation of ABS data. This is the programme's cumulative level effect, not a per-dollar elasticity, and it changes the timing of measured inflation rather than underlying resource costs.
Four designs remain to identify further TITI values, in rising order of data demand.
Pipeline. The released code implements ADF tests, HAC OLS (Newey and West, 1987), Granger tests (predictive precedence only; Granger, 1969), VARs, local projections, walk-forward gradient boosting with SHAP (Lundberg and Lee, 2017) and diagnostics. It stops on missing columns, skips regressions below 30 quarters and machine learning below 60, and returns NOT IDENTIFIABLE for every policy unless a design is declared in a configuration file. Its 12 tests pass; the time-series tests use synthetic data only to check the code, and no synthetic output appears in the results. A separate module computes the direct effects above from documented inputs.
| Component | Implemented | Run on real data | Why not |
|---|---|---|---|
| Tax revenue accounting (growth, contributions, buoyancy) | Yes | Yes | Not applicable |
| Direct effects (fuel excise 2026, energy rebates) | Yes | Yes | Not applicable |
| HAC OLS, Granger, VAR, local projections | Yes | No | Long quarterly series not available |
| Machine learning and SHAP | Yes | No | Sample too short; not causal in any case |
| Cross-country panel (12 economies) | Partly | No | Panel data not assembled |
| Counterfactuals | Skeleton | No | Requires an identified elasticity beyond the direct effects |
Discussion and policy trade-offs
The evidence supports describing trade-offs, not ranking policies, and the descriptions below are not recommendations.
Cross-country context. The energy shock is not specific to Australia: the OECD average tax-to-GDP ratio reached a record 34.1 per cent in 2024 (OECD, 2025), and press reports indicate New Zealand and the United States also raised policy rates in September 2026, though these reports should be verified against central banks. The 12-economy TITI panel has not been built, so no cross-country transmission comparison is offered.
Limitations
Conclusion
The evidence supports specific, dated, mechanical price effects from excise and rebate measures, and two are now measured: the 2026 fuel excise cut lowered headline CPI by about 0.5 percentage points in the month it took effect, and energy rebates lowered it by roughly 0.7 to 1.1 points by late 2024. It also shows a clear reverse channel from prices and profits to tax revenue. It does not support attributing any specific share of Australian inflation to tax policy as a whole, in either direction. Official diagnoses point mainly to supply disruption, energy, demand outrunning capacity, unit labour costs and weak productivity.
The most useful next step is to extend identification rather than add description. The fuel design can be widened to the 2022 outcome, the 2026 restoration steps, diesel and second-round effects. The staggered timing of state electricity rebates in 2024 and Stage 3 by income band offer further credible variation, and the released pipeline is ready to run once quarterly ABS and RBA series are loaded. Until then, every other TITI value for Australia is NOT IDENTIFIABLE, and the paper's contribution is the framework, the evidence standard, two identified direct effects, and a sourced map of where the remaining identifying variation lies.
Appendix: replication materials and items to verify
The replication package accompanies this paper; every figure and table above can be traced to it.
| Item | Contents |
|---|---|
| TITI_AUS_tax_revenue_v0.1.xlsx | ABS and Budget tax series, growth, contribution and buoyancy formulas, policy log, sources |
| aus_tax_revenue_annual_long.csv | 282 tidy rows of the tax series with basis, status and source ID |
| master_data_dictionary.xlsx | 103 variables with definition, frequency, unit, transformation, start and end dates |
| sources.csv | 56 numerical claims with source, series, period, unit, methodology, access date and evidence level |
| src/titi/direct_effects.py | Fuel excise and energy rebate direct effects from documented inputs; writes titi_direct_effects.json and the sensitivity grid |
| src/titi and tests | Framework, models, pipeline and 12 passing tests |
| config/identification.yaml | Declares which policies have an identification design; fuel excise and energy rebates only |
Verify before submission